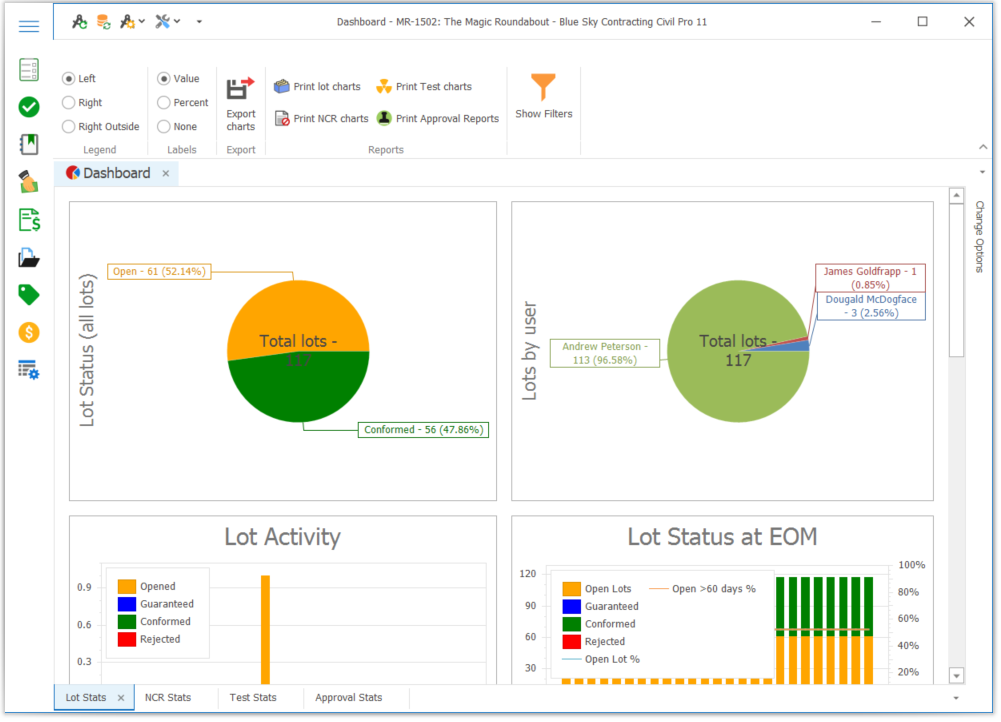
Civil Pro’s dashboard provides summary charts and tables on key registers including;
It is accessed directly from the Quality Assurance section of the main menu.
Contents
Lots
Charts and data are available for;
- Lot Status (at cutoff date)
- Lot Activity (how many lots changed to each status in each month)
- Lot Status at EOM (how many lots had each status at the end of each month)
- Lot ownership by user
- Lot status by user
The charts and register can be customized using the Change Options panel accessed by clicking the expanding panel at the right edge of the dashboard (shown expanded below)
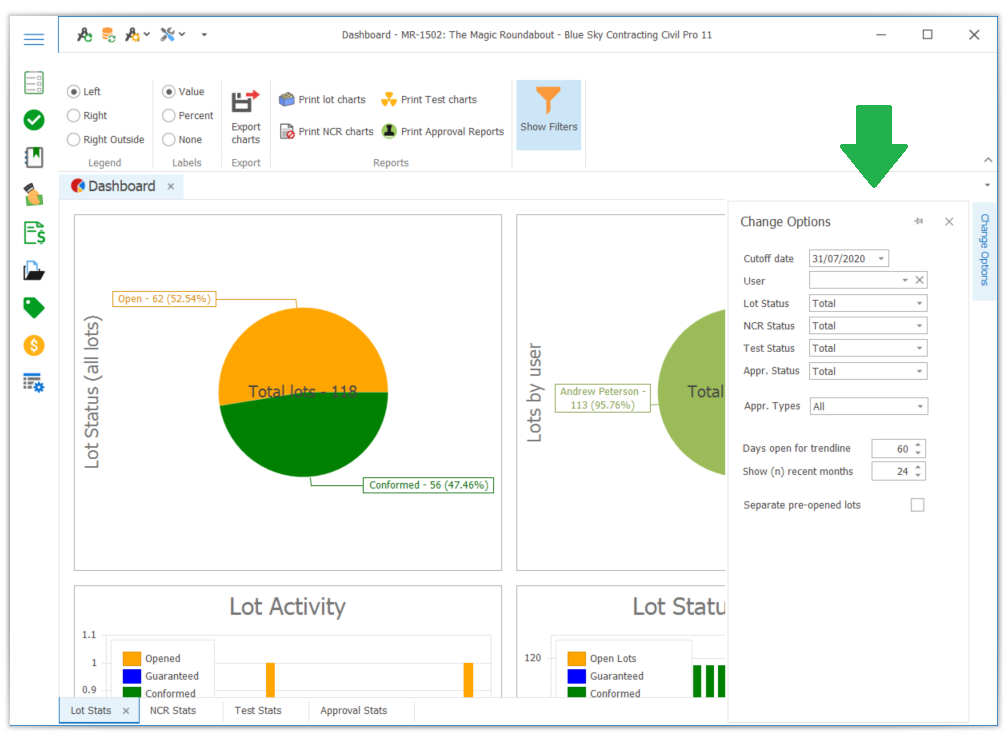
Options relevant to the lot dashboard include:
Cutoff Date
The date after which data is ignored. Typically used to exclude new data at end of month reporting
Lot Status
Shows only lots with a specific status at the cutoff date. This is useful when showing lot distribution among users for a specific status – e.g. if you set this to conformed, you will see the proportion of each user with conformed lots in the Lots by User chart
Days Open for trendline
The Lot Status at EOM shows a trendline for lots longer than a certain duration. By default this is 60 days but this option can change that
Show (n) recent months
Sets the duration (in months) for which data is calculated. NOTE: If for example, you have an ongoing project and you set the cutoff date to 6 months ago, and this is set to 12, you will only see at most 6 months of data. This is because it is calculated from date of the most recent data. To see 12 months of data ending 6 months ago, you would need to set this to 6 + 12 = 18.
Separate pre-opened lots
If set, then the lots without a Date Work Started will be separated into their own status – Pre Opened. You can see this in the screenshot above – the segments coloured Gray
NCRs
Charts and data are available for;
- NCR Status (at cutoff date)
- NCR Activity (how many NCRs changed to each status in each month)
- NCR Status at EOM (how many NCR had each status at the end of each month)
- NCR ownership by user
- NCR status by user
The NCR charts and register can be customized using the Change Options panel accessed by clicking the expanding panel at the right edge of the dashboard.
Tests
Charts and data are available for;
- Test Status (all tests at cutoff date)
- Test Request Activity (how many test requests raised and completed in each month)
- Test Status at EOM (how many Tests had each status at the end of each month)
- Tests ownership by user
- Tests status by user
The Tests charts and register can be customized using the Change Options panel accessed by clicking the expanding panel at the right edge of the dashboard.
Approvals
Charts and data are available for;
- Approval Status (all Approvals)
- Approval Activity (how many Approvals changed status in each month)
- Approvals at EOM (how many Approvals had each status at the end of each month)
- Approval ownership by user
- Approval status by user
The Approval charts and register can be customized using the Change Options panel accessed by clicking the expanding panel at the right edge of the dashboard.
Customizing & Printing
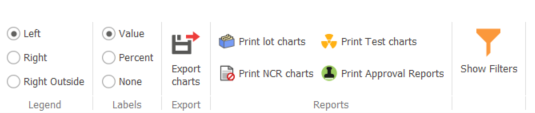
Further customising dashboard graphs and printing options are all accessed via the Ribbon Menu at the top of the screen.